
PERFORMANCE DASHBOARDS
AVAILABLE NOW
You are already
being measured.
Now you can see it.
Programs judge suppliers on a handful of numbers you have never been shown. Performance Dashboards put those numbers in front of you, defined the same way in every program you serve and set against the industry, so nothing in a business review is news.
Why this exists
Nobody should learn how their year went
in the meeting about how their year went.
You are judged on numbers you cannot see
Programs already track how fast you submit, how often you respond, and how many candidates it takes you to land a hire. That assessment exists whether or not anyone has shown it to you.
Four systems, four definitions
Every client program has its own reporting tool and its own idea of what a metric means. You have no control over any of it and no way to add it up into one picture.
And still no comparison
Even after an analyst spends a week reconciling exports, you know your own numbers and nothing else. Is a thirty percent fill rate good? Nobody in the room can actually say.
Your VMS business line deserves to be measured like a business line: one standard,
benchmarked against the market, available whenever you want to look.
What we measure
Six measures, in the order they tell the story.
These are the categories the staffing industry runs on, and the same ones the Beeline Supplier Awards are judged against. Nothing new to learn, and now you can track them yourself rather than once a year.
01 ENGAGEMENT
Response Rate
The share of requisitions you received that you responded to at all.
The straightforward one. Reqs in, reqs answered. It credits the work you put in across everything you were sent, not just what landed.
02 Agility
Time to First Qualified Submit
How long it takes you to put forward a candidate who goes on to progress.
Measured from the moment you receive the req to the moment you submit. Counted only on submittals that qualified, which is narrower than it sounds and worth reading about below.
03 Dependability
Fill Rate
The share of open roles you worked that you successfully filled.
Your hit rate on the demand you were given.
04 precision
Submit to Hire Ratio
How many candidates it takes you to land one placement.
The most established measure in the industry and the one a program reaches for first. If this is healthy, very little else needs defending.
05 velocity
Days to Fill
How long the roles you win take to close out, from receipt to offer acceptance.
Different from agility. That one stops at submittal, this one runs to the end.
06 reliability
Negative Turnover
Attrition across your assignments, including early resignations and releases.
The measure that catches a fast fill that did not last. Placing people who leave costs more than a slow placement.
One of these is the answer. The other five tell you why.
Submit to hire is what a program ultimately judges on. When it looks healthy, the rest is detail. When it does not, the others are how you diagnose it: were you responding at all, were you fast with someone good, were you filling what you won, were the placements sticking. Read them in that order and the picture usually explains itself.
What we measure
What each measure counts, and what it leaves out.
Some of these are narrower than they sound, and a client meeting is the worst possible place to discover that. So we are saying it here instead, plainly, before you look at your own numbers for the first time.
If a measure tells you something uncomfortable, that is usually information rather than an error. Where it genuinely is not, we want to hear it.
Time to first qualified submit counts only the submittals that progressed
Candidates who were rejected are excluded from this measure. So this number can look slower than you expect, and that is deliberate. It is answering a narrower question: how long did it take you to send someone good, rather than how fast you responded.
Qualified means different things in different programs
In some it means shortlisted to the manager, in others it means interviewed or hired. We account for all of them. What stays constant is the timing: from when you received the req to when you submitted.
The clock stops when you submit
However long a program takes to review or shortlist afterwards has no effect on your timing. You are never penalized for somebody else's delay.
Submit to hire counts everything you sent
Unlike the timing measure, this one includes every submittal. That is the industry standard and we have kept it, but it does mean volume without conversion shows up here.
Response rate is the one that credits effort
It counts every req you answered, whether or not the candidate went anywhere. If your outcome measures look harsher than feels fair, this is the number that says what you actually did.
What you do with it
Prepared, not surprised.
Stop waiting on someone else's report. See how you're really doing, whenever you need to.
Walk into the review knowing
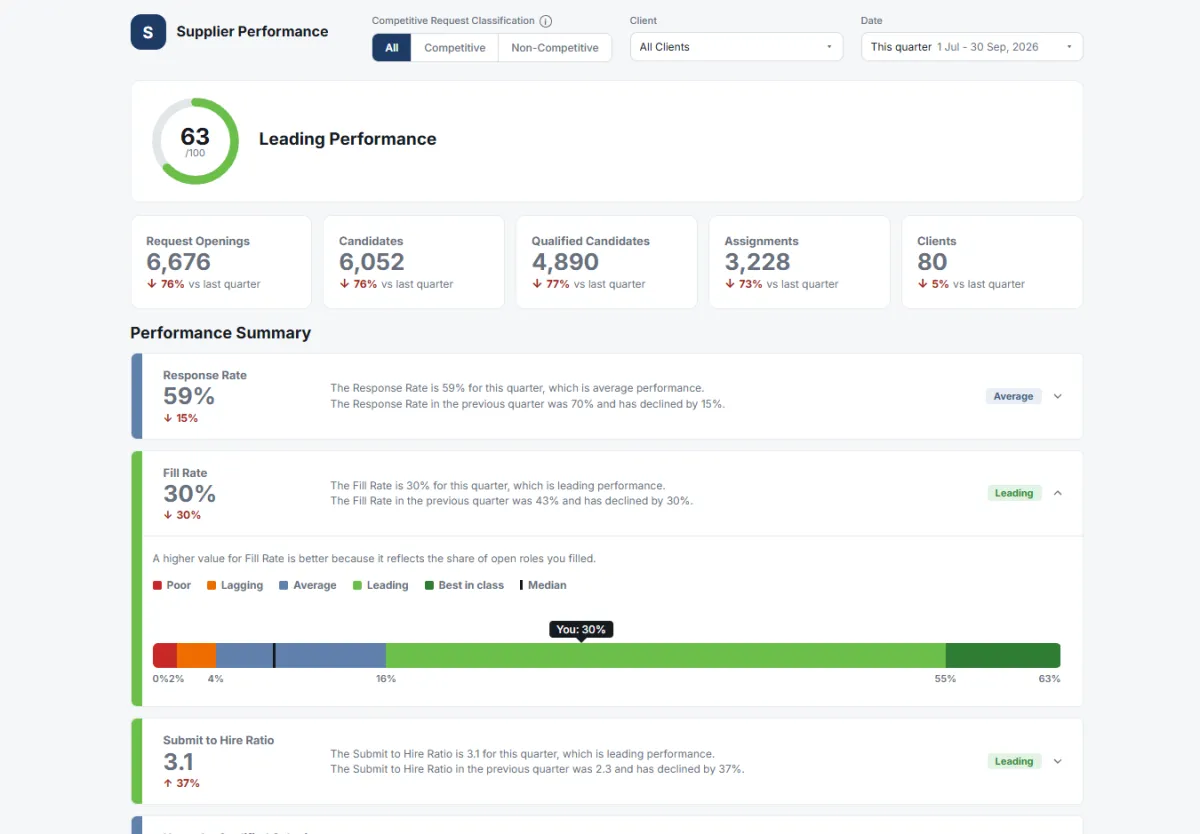
See what your programs are likely to raise before they raise it. Agreeing with a number you already understood is a completely different conversation from hearing it cold.
Find the programs pulling you down
Look across every Beeline client you serve, or filter to one. Same definitions either way, so you can finally tell whether a problem is you or is one account.
Know whether it is actually bad
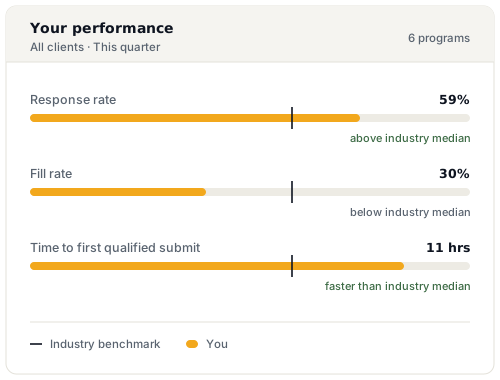
Thirty percent means nothing on its own. Thirty percent against a market median of thirty-eight is a specific problem you can act on this quarter.
WHY TRUST IT
Your data. Your eyes only.
Built from real platform activity, standardized into one definition, benchmarked against the market, and visible to nobody but you.
PRIVACY
Not a program report
Beeline does not share your individual performance scorecard with programs. What you see here stays with you, unless you choose to share it.
STANDARDIZATION
One definition everywhere
Programs configure their own analytics however they like. Here a number means the same thing in every program you serve, so comparing them is meaningful.
BENCHMARKING
Against the market, not a rival
Anonymized, aggregated supplier activity across the network. No individual supplier is identified and no client is described.
FAMILIAR
The Supplier Awards categories
Engagement, agility, and precision are measured the same way here as in the Beeline Supplier Awards. The categories are already yours.
PRICING
Included in all team plans
Performance Dashboards are part of every team plan. Link your Beeline clients in your Supplier Network account and the dashboard appears when it launches.
RELEASING SEPTEMBER 22
Performance Dashboards
All Plan Tiers
Link your clients, no further setup required. Visible to you only.
FAQ
What you need to know about Performance Dashboards
Do I need to do anything to get access?
Link all your Beeline clients in your Supplier Network account. It will be available directly in your BSN account when it launches in September 2026.
Will my clients be able to see this?
No. This is private to you as a supplier. Beeline does not make individual supplier scorecards available to clients. You're welcome to share your own results if you'd like.
Can I see performance broken out by program?
Yes. View your performance holistically across every Beeline program, or drill into a single program.
Is the data updated in real time?
Data is updated on a monthly cadence to allow for the volume of activity to be properly reflected in your dashboard.